Blogs
Mar 24, 2025

Customer churn in the current trends is a fact of life for every business in every industry. Customers in today’s digital age have unprecedented access to data, thus enabling easy comparisons of competitive products and hassle-free provider changes with a simple click of a button.
Churn has a very significant impact on businesses as it induces revenue loss and ultimately reduces profits. Yet very surprisingly, more than 2 out of 3 companies have no strategy for customer churn reduction. This is appalling, considering the fact that customer acquisition costs are five times more than retention costs.
Churn is a complex problem. The evidence of this complexity appears in the variety of articles, guides, e-books written on the subject. HubSpot has an entire e-book on this topic. Shopify explains it in its churn article. Consulting firms have hundreds of articles on this topic. Every firm has their own view of understanding and managing churn. However, the underlying principle of business remains same: Users will churn, when the value delivered by you is less than the inertia of users to visit your competitor or to not use the product/service/subscription entirely.
Customer Journey
Table of Contents
What Is Churn?
A very famous story explains the importance of churn definition. In the year 2004, Netflix was sued by its shareholders over its reported churn rates. The shareholders argued in the court that Netflix used an “improper calculation of the rate that brought about an artificially low customer churn rate performance”.
The judge threw out the case on the ground that “there is no single industry-wide definition of churn rate”.
The most basic definition for customer churn is cited as the number of customers who stop doing business with you during a given timeframe.
Churn or rate of attrition is a business term and can be calculated in a few different ways:
The total number of customers lost during a specific time period.
Percentage of customers lost during a time period.
Recurring business value lost.
Percentage of recurring business value lost.
We can calculate churn by using the formula below:
Customer churn Rate (in%) = Customers Lost During the Period/Customers at the start of the Period
The basic churn formula will remain the same, but we should modify this according to your business and the shopping cycle of your customers.
As an example, suppose if we had 100 customers at the beginning of January 2020, and during January, we lost 18 of those customers, our churn rate for January is 18%.
Therefore, the churn rate would be 18%.
Yay, it’s s simple, you think?
Not really!
We need to put few things into perspective before we study churn.
There are many things that you need to consider before getting this quantitative metric of churn percentage. This quantitative metric adds more context to the churn rate and most of the time, it changes the entire equation if one of them is not accounted for.
How Do You Define When One Has Churned In Retail?
Let’s imagine a classic gold-tier shopper for a fashion retailer. Nicky, a loyal customer who visits once every 60-90 days, shops more than 2-3 departments or categories each time, maintains a high average shopping basket. Nicky, however, has not been to the store for more than 2 months now. Should we be worried that she has churned? Is she on vacation, has she switched to competitors?
Every retailer searches for the pieces to this puzzle. Because visit frequency changes for a variety of reasons, how should retailers define churn and detect churn propensity to react to it before it’s too late? In Nicky’s case, when should she be targeted with personalized offers to get her back to the store?
These challenges require a robust definition of churn or churn propensity that accounts for each customer’s shopping pattern, a set of parameters rigorous enough to alert for churn propensity, and early enough to take remedial action.
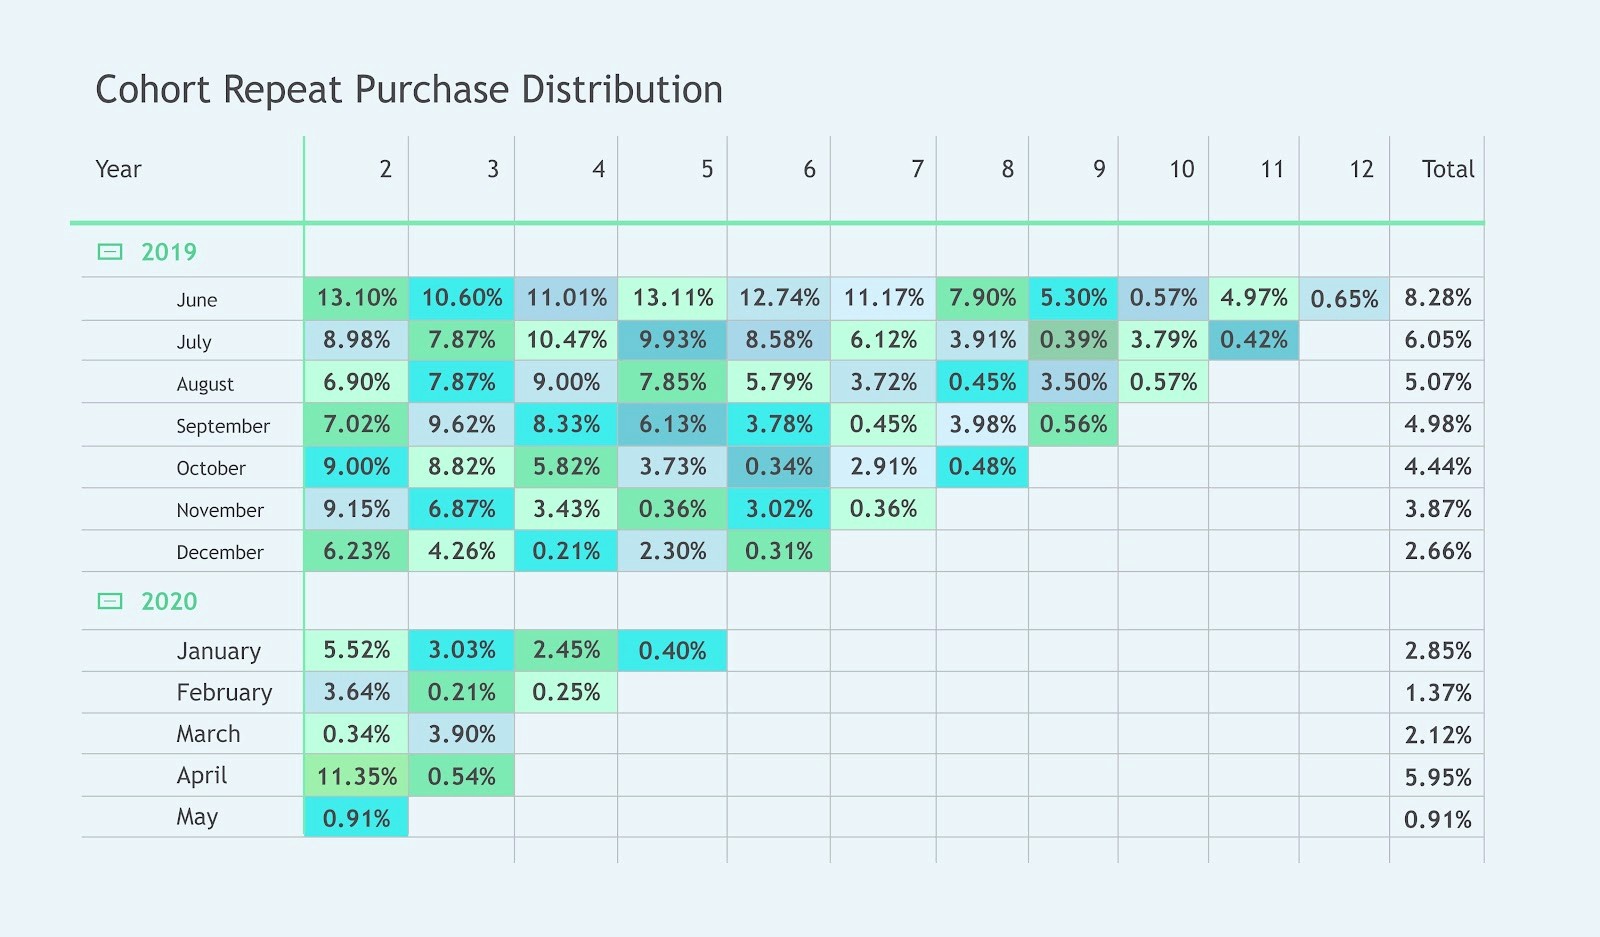
Increase repeat purchase using cohort distribution
1. Company Churn Or Product Category Churn
As in the above case of Nicky, what would the retailer do if Nicky still visits every 60-90 days but Nicky now visits only 1 category and her average shopping basket value has also decreased?
After some data exploratory customer churn analysis, the retailer would find that Nicky has stopped buying formal and office wear sections. The retailer would discover that Nicky used to buy XXL size formal wear and off late customers could be visiting less to this section who used to buy plus size products. Data could show that the churn rate for the formal wear plus size category has increased a lot.
After a customer focus study, the retailer might unearth that the design choice of that category was not good and a competitor had very good designs in the category. Hence the churn of the formal wear went up, driving up the overall churn rate of the store as customers who used to shop in only that category stopped visiting the store.
The above example shows that churn can happen at the brand or store level and also at the department or product category level.
2. Customer Churn Vs. Revenue Churn
If Nicky stops visiting the store, then it is customer churn. What if Nicky still visits the store regularly, but now the average transaction value is 60% of what she used to spend earlier? This is known as revenue churn.
The revenue churn rate will come into play when we consider the user or customer lifetime value (CLTV) while creating churn propensity-based reactivation campaigns. The customers who have higher CLTV should be given priority.
As every reactivation or engagement marketing campaign is associated with marketing spend and promotional giveaway, it is better to start the campaign by giving priority (Net Score) to the customers who have a high propensity to come back and also have high CLTV.

Impacts due to churn for a wellness retail chain
Numerous other factors ought to be considered like seasonality, trialists and repeaters profile, a sample size of churn segments, impact by different user segment cohorts, etc.
Why Is Churn Important?
Every retailer knows why churn is important. Below are few facts just to give some perspective to it.
Companies lose $1.6 trillion per year due to customer churn! (Accenture Report)
The Harvard Business School report claims that on average, a 5% increase in customer retention rate results in a 25% – 95% increase in profits. And the lion’s share – 65% of a company’s business comes from the current customer!
50% of customers naturally churn every 5 years. However, only 1 out of 26 unhappy customers complain; the rest simply churn. (Kolsky)
Types Of Customer Churn
1. Voluntary And Involuntary Churn
Firstly, we need to embrace the insight that customer churn happens both voluntarily and involuntarily.
In this article, we will focus on voluntary churn, because voluntary churn has actionable insights and prevention steps, while involuntary churn is mostly unavoidable. They arise in the face of unforeseen events such as when a customer stops visiting the retailer due to death, relocation, etc.
2. Contractual And Non-Contractual Churn
In contractual business settings or so-called access services where we observe customer usage while “under contract” or autopay, the cancellation of service is considered as churn. And it is notified by customers and recorded like Netflix, cell phone service providers, etc.
In non-contractual businesses like retail, customers are free to buy or not at any time. The churn event wouldn't be explicitly observed. The churn is defined based on the signature shopping cycle of the customer’s transaction history.
3. Customer And Revenue Churn
Customer or Account Churn: Where the customer is completely lost and is no longer visiting the store or using or paying for the service.
Product Category Churn: Where the customer has lowered their engagement and reduced the number of categories they used to buy or lowered subscription profile but remains a paying user.
Decreased Spend: Where the customer has reduced their spending, reduced visit frequency, or average transaction value without stopping shopping entirely. It could also be subscription downgrades, such as watching movies from a lower tier for an on-demand movie service provider.
How To Reduce Customer Churn?
Churn is inevitable. One cannot stop involuntary churn and in retail, there will always be voluntary churn as well. We cannot make it 0% but we can surely manage churn and reduce it. Here are few suggestions on how we can minimize it with customer churn analysis.
1. Improve Customer Experience
The seeds of slow churn are sown throughout the customer experience, so it’s necessary to have a clear engagement strategy for each instance of the customer journey. Treating only the last episode rarely leads to a complete solution that addresses the customer’s discontent which can result in churn.
The entire customer journey is a very important insight into the customer experience and unveils the touchpoints that can increase or decrease spend or visits of a customer. Basic experience is very important in retail, right from store location, pre-entry experience to in-store experience like customer service, competitive pricing, a wide range of products, store layout, queue wait time, after-sales service, product return policy, right ambiance, etc.
For example, Zumtobel claims a fashion retailer in Germany saw its sales go up by around 12% compared to another local store after it installed a new lighting scheme specially designed to appeal to the personality profile of its target customer base.
2. Talk To Customers
The best way to reduce churn risk is to understand the reason behind it. One of the best ways to understand why your users are churning is to talk to them. One can try sending a customer survey like N.P.S., etc. or one can go straight to the source by calling a segment of customers and talk to them individually by creating a focus group and having an honest, open conversation about why they have stopped shopping.
The feedback might be harsh and most of the time they will not reply when approached for feedback. But few of them will reply and then at least you’ll get more context to the reason behind churn.
It is very important that a brand creates a customized customer happiness index score (or any engagement or satisfaction or NPS score) and track it consistently. Take proactive actions on the feedback to improve the average customer experience with your brand.
3. Create Segments And Microsegments Of Your Customers
McKinsey did a case study on churn and found out that companies with the best customer retention rate employed a rigorous process of segmentation and micro-segmentation.
The segmentation feature helps companies to focus on a customer base with similar attributes. Customer segments can be based on customer action that we can get by analyzing past transactions, based on customer demographics, and others. This holistic approach helps to personalize the reactivation offers while keeping the cost very low as compared to any blanket reactivation campaign where a brand sends a communication to all the lapsed users.
For example, RFV segmentation can help companies to focus on reactivating customers who lapsed recently and had high frequency and high LTV earlier. This integrative approach enables you to spend your limited marketing budget on the customers who had high revenue churn and have a high probability to come back to the store.
4. Increase Customer Engagement
How to increase customer engagement?
Well, this is much easier said than done, but when done well, this can do wonders to reduce churn. Engaged customers are the ones who are interacting more with your product and your company, participating in your loyalty program (if any) and they tend to be more satisfied customers.
A team at HubSpot realized the importance of understanding churn and being able to look at it through the eyes of measuring customer engagement. The team developed a customer engagement system that delivered a Customer Happiness Index Score or more commonly known as CHI Score. HubSpot used this CHI score to identify customers that were at risk of churning and used to call those customers and improve their usage of the product.
Similarly, Ingage also has a free customer engagement score calculator. It helps you measure the score based on the retail sector you belong to and gives you informative strategies to improve the same if the score is low.
5. Customer Journey Analytics
According to a study, customer journeys render actual predictions of customer satisfaction and churn by up to 30-40%. Brands that analyze the buyer journey and effectively communicate at the critical touchpoints have more happy customers and less probability to churn.
The right customer journey analytics solution will give brands the audience insights in terms of the clearer picture, so that you know the persona and signature shopping style of your customers, what their mission and goals are of their shopping trips, and which channels they are utilizing to interact with your brand at every step of their customer journey.
6. Be Agile, A/B Test, Refine, Reject, Repeat And Learn As Fast As Possible
As per McKinsey, most successful companies use test-and-learn processes by continually developing new offers or benefits for customers and deploy them to test their effectiveness.
Every month new Segments, customer attribute, journey related feature is developed, and these segments or features are tested as soon as possible through A/B Testing. Whenever there is a significant impact driven by this new feature, it is being rolled out across primary target customers.
Use Of Predictive Analytics In Customer Churn And Its Impact
Churn is a Lag Indicator. That is, the loss has already happened, and it's just a measurement of the damage inflicted. To reduce or manage churn, one needs to create EWS (Early Warning Systems) based on lead indicators or drivers of churn. This will help the brand to find customers who are at risk of churn, find the customers (based on CLTV and response model score) on whom the brand should focus to retain, and take remedial pro-active actions.
According to Seongjoon Koo, Chief Data Officer, J.D. Power, “Predictive churn analysis can be used to identify valuable customers at the brink of a high churn level and help organizations take requisite actions by paying more attention to such customers in a personalized manner.”
A BCG study reveals that by employing a prediction churn model and arming business managers with data-driven insights and analytical insights, corporate banks can reduce churn by 20%-30%. This can help the bank to increase its sustainable growth of revenue twofold. A McKinsey study explains how an analytics-based accurate approach to base management of a telecom company can reduce their churn by as much as 15%.
Many predictive models and analytics methods can be used to point to churn indicators. Let’s discuss just a few steps briefly how analytics helps to reduce churn.
1. Define Churn As Per Your Business
Churn is defined based on various common methods, and you need to create your churn formula based on your customer shopping cycle. To name a few, here's how it can be defined or tweaked in different retail scenarios:
Those who do not visit after a time frame, let’s say 90 days, might be defined as churned. In this case, businesses might want to act on customers who did not shop in 45 days and see those customers as at-risk customers.
Brands or category managers might want to define churn as a customer who does not come back to buy a product category based on his signature shopping cycle or inter purchase time.
Based on its likelihood to return, decay functions, survival functions of churn distributions, etc.
2. Create Segments
Create a customer bucket of segments and micro-segments using clustering based on CLTV, RFV, profitability, etc.
3. Predict The Propensity To Churn
Give a churn propensity score based on predictive artificial intelligence-based algorithms, machine learning algorithms, and analysis techniques to ensure accurate predictions of churn. Using these advanced algorithms and predictive models, you can improve Return On Investment (ROI) by nearly 10-20% and lower the marketing cost by 50%-70%.
4. Use The Churn Score
Using the customer attrition score and CLTV-RFV segmentation feature, we form micro-segments or cohorts and then create cohort-specific marketing plans to retain or reactivate the at-risk customers. We focus more time and effort on customers who have medium to high CLTV, and a high probability to respond to the reactivation campaigns.
Based on customer behavior, we can create a product recommendation engine as well, and find the best products based on which we can send customized offers. The research found that online retail browsers who engaged with a recommended product had a 70% higher conversion rate during that session.
These personalized offers can then be sent to the at-risk customers at the right time (morning/evening/others) on the right day (Saturday/Friday/others) using the right communication channel (SMS/email/push notification/WhatsApp/call/combination/others) using customer journey analytics.
5. Measure The Impact
Measure the impact of your reactivation campaigns: both in the short term and long term. Test, refine, reject, and learn based on the outcome of your reactivation or customer retention strategies.
You must measure your campaigns correctly and find out which cohort is responding better to which type of campaign metrics and refine the churn prediction models accordingly.
This will also help you to find and improve the key performance indicators (KPI) of your campaigns and CLTV of the at-risk customers over a period of time.
6. Get Customer Satisfaction Surveys
Get customer feedback surveys and do sentiment analysis on the feedbacks to get the churn drivers. Improve business processes based on your findings on what is driving churn. Make sure that customers have great experience in their entire journey with your brand, and turn this into a driver of growth.
As shared by Neil Patel, implementing and responding to NPS surveys can have a direct 30% decrease in the customer attrition rate.
Five Quick Ways To Keep Churn Under Control
1. First Impression Matters: Send A Welcome Mail
In a survey by ClickFox it was found out that:
48% of surveyed consumers shared that the most critical time for a brand to gain their trust or loyalty is with the very first purchase or service.
40% of surveyed consumers shared that the most critical moment was when a brand had the opportunity to resolve any issue.
A simple step like sending a welcome email can make a user feel good and help them remember the brand.
Brands need to follow the entire journey of a new customer from the moment they find you online or enters a store, until the feedback received from customers post-sales, to ensure that there is a seamless and awesome customer experience.
2. Quality Of Customer Service And Prompt Issue Resolution
The relationship of a brand with its customers only begins with the sale. Quickly and efficiently handling any issues that a user may have with your product or any service is the second most critical moment in the journey to generate trust or brand loyalty.
According to Zendesk, 82% of consumers have churned because of bad customer service and not just because of bad products. Churn because of poor service stands at 70%, according to Forum Corporation’s research. Studies show that nearly 60% will never use a company again after one bad experience, and nearly 50% who have had a negative experience will tell more than 10 people about it.
3. Give More Value To Customers, Consistently
If your valuable customer is getting high value for money, there is less chance for them to leave you or your brand.
Many brands say that failing to deliver on a promise is one of the main reasons for customers to churn. Making a great first impression is not enough for a brand to retain customers. Brands also must consistently meet customer expectations and exceed them whenever possible.
4. Focus On Your Best Customers Who Are At Risk
For most businesses, reducing churn or reactivating lapsed customers means identifying a pool of customers and refocusing your efforts to keep them on board.
However contrary to this idea, Mr. Sunil Gupta, the Edward W. Carter Professor of Business Administration at Harvard Business School, suggests that this strategy to target all at-risk customers is lacking.
Rather than redirecting efforts and resources to retaining any customers on the brink of churning, Gupta recommends brands to focus their attention on the most profitable customers on the brink of churning.
Sunil Gupta explains "If I offer an incentive to customers most likely to churn, they may not leave the company, but will it be profitable for me? The traditional method is focused on reducing churn, but we contend the goal should be maximizing profits, rather than only reducing churn."
5. Personalize Communications And Engage With Your Customers By Getting A Good CRM
Reach out to your customers before they need you as this will help to increase customer’s mindshare for your brand. But the old way of sending standard mail or SMS is lacking performance. The communication must be personalized based on the signature product usage of the customer.
A good CRM helps brands to send personalized communications to customers regarding the products they love at the right time delivered through the right marketing channel.
Few impact-driven uses of CRMs are as follows:
Send personalized welcome mail, upsell/cross-Sell mailers, and others based on product recommendation-driven dynamic emailers.
Send offers on birthdays, anniversaries, and other special days.
Send customized offers, incentives, product updates, etc. to reactivate customers, increase visit frequency, etc.
Create customer journey-based campaigns. For example, specific offers for new customers so that they can come back within 30 days of visiting the store.
Here's a customized emailer from SEMRush after signing up to motivate customers to explore more features of the tool.

Customized emailer to motivate customers
Predictive Churn Analytics To The Rescue!
Customer churn is inevitable. We must admit that saving every customer might not be realistic. We have to understand which customer churns are voluntary and how we can manage them efficiently and effectively.
We need to use the power of advanced analytics, business intelligence, and marketing to effectively combat churn over time and strive continuously to create an awesome customer experience for our loyal customers.
Retention with churn analytics can be a very powerful addition to the marketers' tools and techniques as it reduces costs and boosts the ROI of reactivation marketing efforts.
If you have questions related to churn or other problems in your business model, don't be afraid to ask us.
How do you approach reducing churn in your business? Let us know!